 |
| U.S. Census Bureau map; click the image to enlarge it. |
Census Bureau statistics released Thursday "portray dense, diverse and growing metropolitan areas, while rural areas struggle to grow – or even hold on to their populations. That will have implications as states use the data to redraw their congressional boundaries in upcoming months, shifting political power and representation among their residents," Matthew Brown reports for USA Today. Rural population loss could make it more difficult for some areas to get federal funding, since areas without a large enough population can be shut out of certain programs and spending.
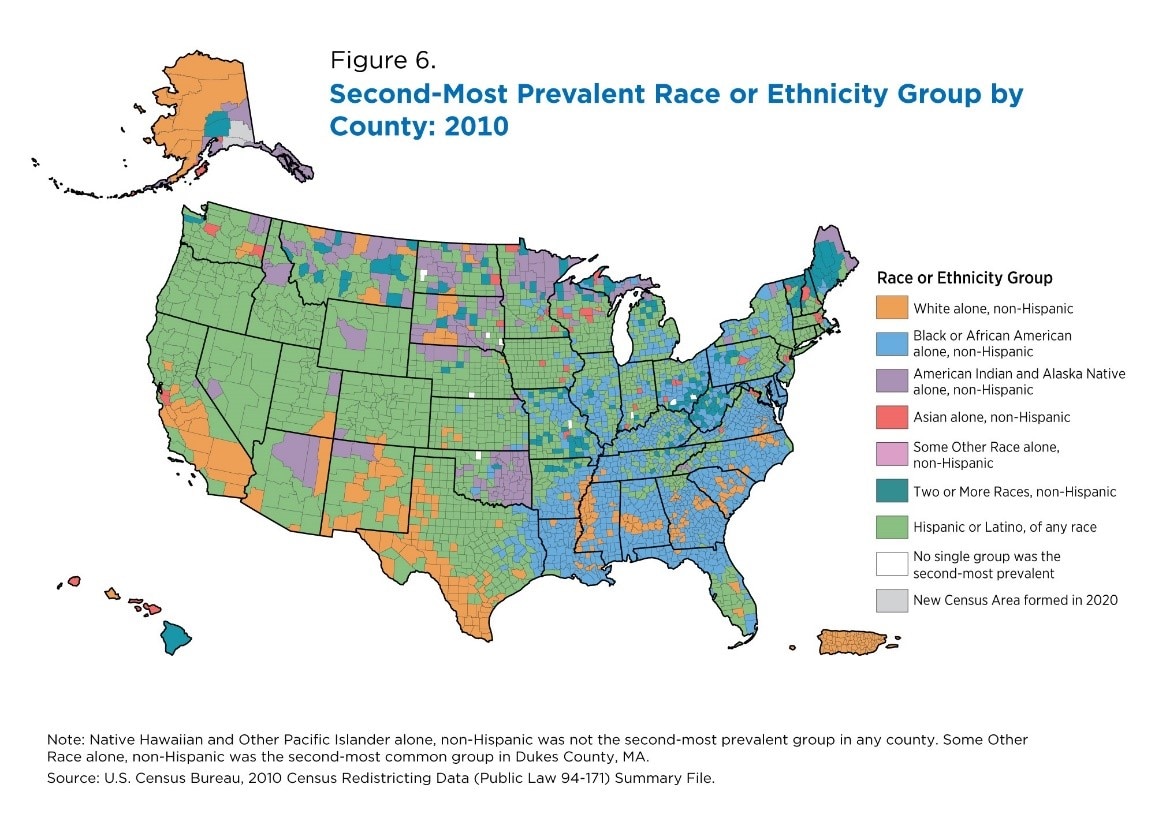
The new data showed, as expected, that the white population of the U.S. declined for the first time, though they remain the majority in most counties. But, a map showing the second-most prevalent race or ethnicity in each county illustrated the growth of Hispanic and multi-racial Americans:
 |
| Second-most prevalent race or ethnicity in U.S. counties, in 2010 and 2020. Census Bureau maps for 2010 and 2020, adapted by The Rural Blog; click to enlarge it. |
A package from The Washington Post has interactive maps at the state- county-, and census-tract-level showing how the racial makeup of the U.S. has changed since 1990. Among other things, it illustrates how Black Americans have increasingly moved away from rural areas.
Here are some other highlights of the report:
- Metropolitan areas grew by 9 percent while non-metropolitan areas grew 1%.
- Fewer than half of the nation's counties grew in population.
- Even in rapidly growing states, rural counties on average lost population while rural and suburban counties outpaced expected growth.
- Overall population growth is slowing: the U.S. population grew by 7.4%, down from 9.7 in the last decennial census.
No comments:
Post a Comment